Satellite data
Based on PlanetScope satellite data, we provide a detailed overview of the current state of crop growth with high accuracy. Using the SAVI vegetation index, which minimizes the influence of bare soil, we divide each field into 13 agronomically significant zones based on vegetation development. A spatial resolution of 3 metres per pixel and an image acquisition frequency of 1–2 days enable more frequent monitoring, especially during the critical spring period. All of this contributes to better awareness, more informed decision-making, and more efficient management of agronomic operations.
MANAGEMENT ZONES
Management zones display long-term field variability based on historical time series of satellite data. More than 300 Sentinel-2 images captured since 2015 are used to identify high- and low-productivity areas within fields based on the average SAVI value.
Images with cloud cover or without vegetation are automatically excluded. The management zones are then divided into five zones using the Natural Breaks (Jenks) algorithm. These zones can be used as a basis for variable-rate sowing or fertilization.
SAVI INDEX
SAVI (Soil-Adjusted Vegetation Index) is a vegetation index that displays the current state of vegetation while reducing the influence of bare soil. CleverFarm's algorithm classifies
SAVI values into 13 different zones that reflect differences in vegetation development across fields. It is commonly used as a basis for the variable-rate application of nitrogen fertilizers. SAVI values change over time, allowing you to easily determine whether crop growth is below average or in excellent condition during a given period. This makes it possible to plan agronomic operations more effectively and respond to the current state of vegetation in each field.
soil & plant analysis
Soil samples provide detailed information about the chemical properties of the soil in your fields. The analysis reveals any nutrient deficiencies that can negatively affect crop growth and yield. Based on the results, fertilization can be better planned, production quality can be improved, and long-term soil health can be enhanced.
The results of the analyses also serve as a basis for creating prescription maps for variable fertilisation. CleverFarm can process soil sample results from any laboratory, provided the following information is available: GPS coordinates of the sample, values of the analyzed parameters (e.g. pH, N, P, K, etc.), and the methodology used for the laboratory analysis. The results are displayed on the platform, and zones are created based on data interpolation. These zones can then be used as a basis for variable-rate fertilisation.
Poptat rozbor půdy a rostlin application maps
In CleverFarm, you can easily generate application maps for individual parcels, or in bulk for multiple parcels at once, based on available data. Thanks to this, you can quickly and easily prepare maps for fertilisation, sowing, or other applications.

Application map formats and machine data transfer
CleverFarm allows you to generate application maps for all types of terminals that support map uploading for variable applications. This includes machines from brands such as Fendt, John Deere, Massey Ferguson, Valtra, New Holland, Case IH and Steyr. In addition, we offer the possibility of remote data transfer directly to the machine. This saves time and helps operators avoid potential problems and errors when transferring maps via USB. We work with the native systems of the machines, without the need to install additional terminals.
The CleverFarm application can generate application maps in the following formats: Shapefile, Trimble FMX, Precision 20/20 Shapefile, Raven Viper, Satloc-G4, Satloc-Bantam, SiteMate, TeeJet ISOXML, Trimble AgGPS 170 Prescriptions, Trimble FMD, John Deere GS1, GS2, GS3, Global Rx and GS2/GS3 Rx Shapefile, Kinze BlueVantage, Kinze Multi-Hybrid Shapefile, Mid-Tech, Müller ISOXML, Case Voyager2 (including raster version), Generic ISOXML Type 1 and 2, Pro700 TaskData, Pro700 Shapefile, AGCO AccuTerminal, Fendt VarioTerminal, Ag Leader TGT Publisher, IRX, AGSETUP, InCommand, AgView, and AIM.
After completing field application and finishing the task, you can view details of the performed operation (so-called as-applied records or task data) and verify the correctness of the application. CleverFarm supports visualization of files in ISOXML format.
For Fendt, Massey Ferguson, and Valtra machines, as-applied data can be transferred remotely from the terminal to the CleverFarm application.
Automated base fertilization planning
Prepare application maps in just a few minutes
NPK Agent automatically suggests optimal fertilizer rates for individual management zones based on yield potential, target yield, and soil nutrient levels. The result is prescription maps ready for variable rate application, which significantly reduce the time needed for fertilization planning and help you use nutrients more efficiently.
What this feature brings you
- Automatic rate calculation based on yield potential and soil analysis.
- Prescription maps prepared for variable rate application in agricultural machinery.
- Higher fertilization efficiency through targeted nutrient application.
- Time savings, as the system prepares proposals for multiple plots at once.
- Option to manually adjust calculated rates based on your own agronomic experience.
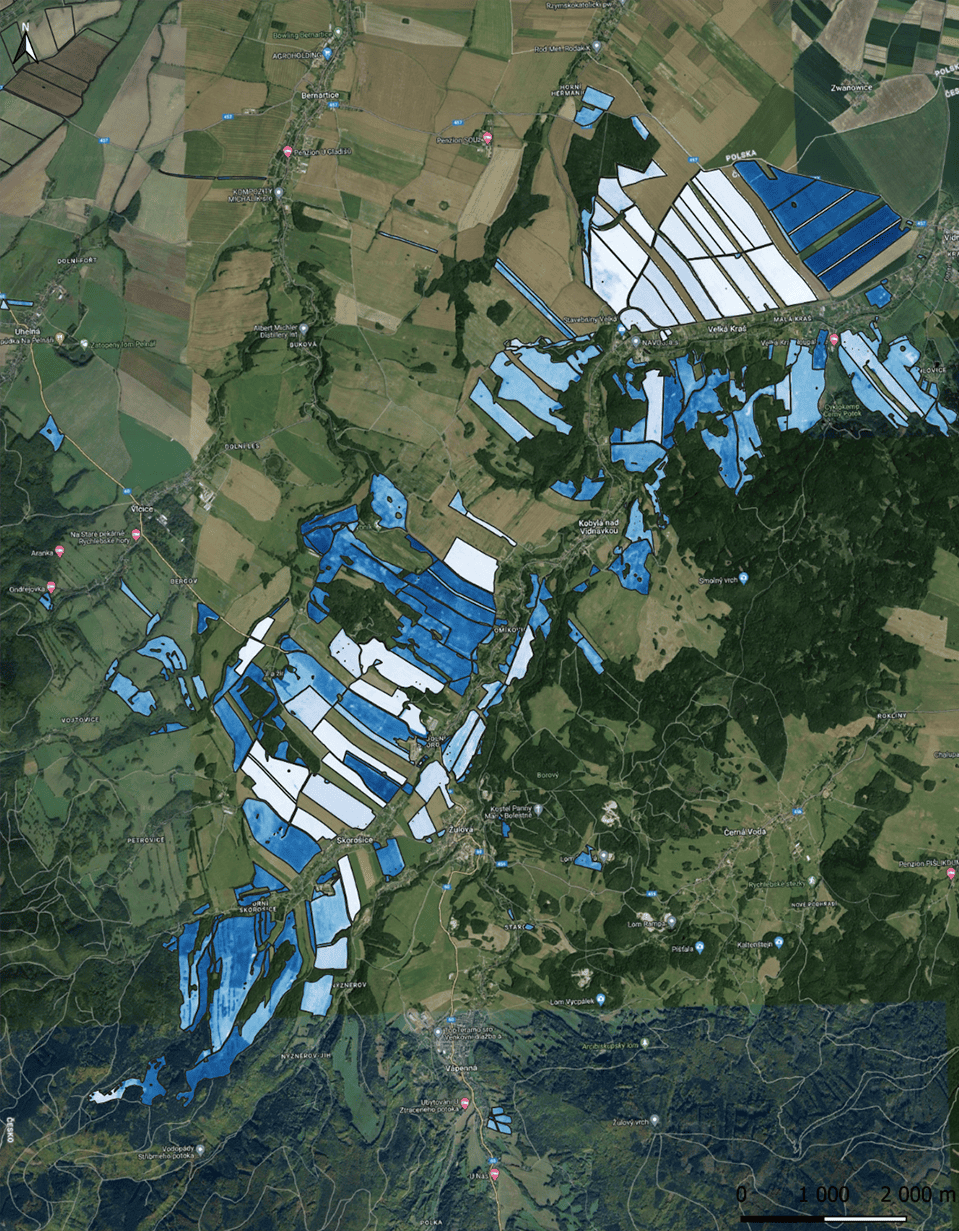
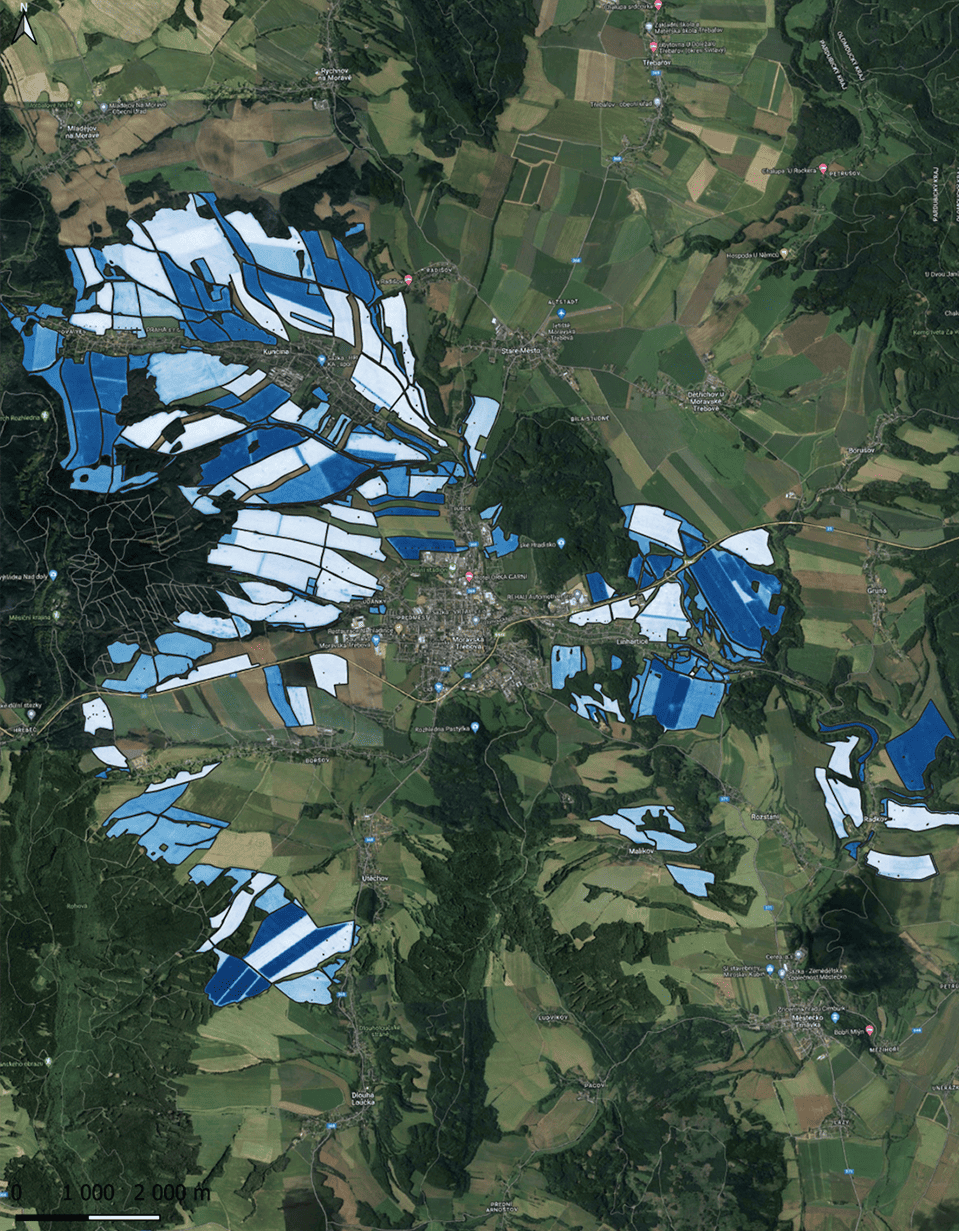
NDWI Water indeX
will help you decide when and on which plots to start harvesting. This tool, based on satellite data, provides accurate information on crop moisture levels. NDWI uses the green and near-infrared (NIR) spectral bands to identify water content in plant leaves. The output is a map that visualizes index values across all your plots. This is particularly useful during harvest, when it is often difficult for agronomists to determine crop moisture levels without accurate data.
Thanks to NDWI, you can send the harvester directly to the driest parts of the field, saving time, reducing the risk of losses, and increasing harvesting efficiency.
How do our clients evaluate the benefits of NDWI?
”At Agricultural Cooperative Trenčianska Turná, last year the NDWI index significantly saved us time — we did not have to walk through fields with handheld moisture meters. It was especially helpful for corn, where the precise data allowed us to better plan the harvest. We will definitely use the NDWI index from CleverFarm again this year.”

Ing. Milan Ščigulinský
Agricultural Cooperative Trenčianska Turná, Slovakia
economic evaluation
Throughout the season, we help you collect and evaluate data, adjust strategies, and respond to current field conditions. At the end of the season, we prepare a detailed evaluation of precision agriculture — taking into account meteorological conditions, yields, economic impacts, nutrient balance, and nitrogen utilization. All of this is provided down to the level of individual parcels or zones.
The output also includes recommendations on how to optimize farming in the upcoming season.
Yield
MAP
Yield maps from harvesters show exactly how much you harvested at each field location. Thanks to them, you can understand the real impact of your agronomic interventions. The CleverFarm platform cleans the yield data, aggregates it from all used machines, corrects any deviations, and uses it as a basis for a detailed economic evaluation of the entire season.
Supply of Pure
nitrogen
The net nitrogen supply map shows the total amount of nitrogen delivered to individual parts of the field during the entire growing season. It includes the sum of all nitrogen fertilizer applications in a given period. When combined with a yield map, it is possible to calculate the so-called PFP index, which evaluates the efficiency of nitrogen utilization in individual parts of the field.
PFP
index
PFP Index (Partial Factor Productivity) indicates how many kilograms of yield are achieved per kilogram of applied nitrogen.
This indicator helps evaluate fertilisation efficiency — the higher its value, the better the plants utilise the supplied nutrients and the lower the risk of over-fertilisation or inefficient nitrogen use.
Would you like to see an example of our evaluation?
Contact us and we will promptly send you a presentation with an economic and agronomic evaluation of the entire season.

.png)


.png)


%20(1).jpg)

.jpeg)
.jpeg)
.jpeg)
.jpg)
.jpg)
.jpeg)
.jpeg)


.png)
%20(1).png)




.jpg)
.jpg)
.jpg)